Remind me to be very, very careful on my next (well, ...first) visit to China. As you know, Lizard Point is in the business of using maps to help people learn more about the world they live in, and in China - that can prove to be a risky proposition.
According to this article on ozy.com, China has a law against any illegal map that “endangers the country’s sovereignty, safety and interests”. And if your map doesn't comply with the country's rules - you can be in for a fine of up to 200,000 yuan (about $30,000 USD). The rules include naming the South China Sea properly and marking Taiwan, Hong Kong and Macau in the same colour as mainland China.
Er, excuse me while I go double check our quizzes.
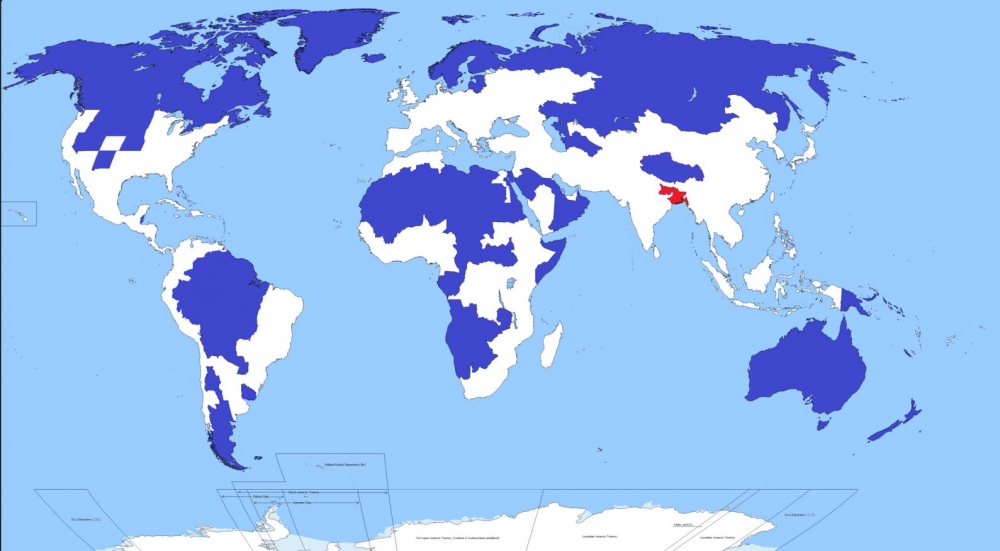
Another very interesting visualization of world population from the folks in Reddit. Only 5 per cent of the world's population lives in the regions of this map shaded blue. Another 5 per cent lives in the area shaded red.
Reddit MapPorn - account IbisDigitalMedia
We found the map in a very interesting article from the web site CityMetric, who included some interesting facts and deduction.
According to CityMetric, the red area includes Bangladesh (pop: 156m), and the Indian states of Bihar (pop: 104m) and West Bengal (pop: 91m). It also includes two megacities: Kolkata in West Bengal (15m), and the Bangladeshi capital of Dhaka (13m). In all, that’s a combined population of about 351m people in roughly 330,000 km2, giving a population density of 1062 people per km2.
The blue area includes Canada, Greenland, Iceland, Norway, Sweden, Finland, Estonia, Latvia, Lithuania, huge swathes of northern and Asian Russia, Mongolia, most of the Amazon basin, Patagonia, large swathes of Africa and the Arabic peninsula, the US states of New Mexico, Nevada, Utah, Kansas, Nebraska, Idaho, Wyoming, Montana, and both Dakotas, and pretty much the entire Australasian continent.
As CityMetric points out, the map is a bit of a cheat. They've assumed that whoever made the map calculated how many people 5 per cent of the global population is, and then started working their way down a list of big areas with low population density until they hit their magic number. It’s a slightly artificial way of doing things, and leads to odd things like the exclusion of the Nile valley and the thin sliver of South America on its populated Pacific Coast.
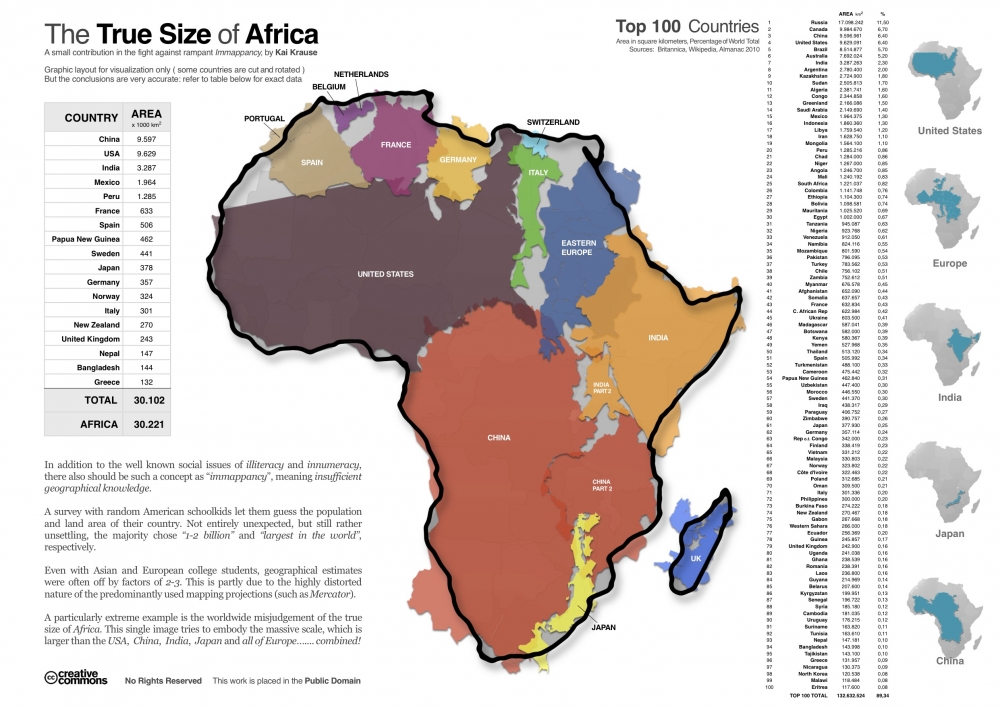
Another brilliant graphic that illustrates the true size of Africa (click on the map to see the full sized version).
This graphic very visually demonstrates that Africa alone is larger (in terms of area) than China, USA, India, Mexico, and much of Europe and South America. The power of this graphic and the surprise that it creates for readers, is based on the deep impressions made by the Mercator projection used in most maps that distorts the true size of many countries. This projection, published in 1569, was immediately useful because it depicts a line of constant bearing as a straight line, which is handy for marine navigation. The drawback is that it distorts the shapes and areas of large land masses, and the distortion gets progressively worse as you get closer to the poles.
We kind of get used to some pretty amazing technologies. For instance, GPS (or Global Positioning System) has only been available to consumers for a little over 10 years. Yet, most of us have already become pretty dependent on our GPS enabled devices. It is rare to drive in a car without a GPS device and almost every smartphone will be enabled. (And some of us use these devices to enjoy geocaching as we've talked about before). But how many people understand how they work? We're going to explain that to you... simply (because that's about our level of understanding).
Let's start with satellites. There are about thirty or so satellites continually circling the earth at about 30,000 kms (12,000 miles). These are solar-powered satellites each about the weight of a mid-sized car. These satellites are always sending encoded signals in every direction. The orbits of the satellites are designed so that at least 4 and usually more, are in line of sight to every point on earth at all times. It actually takes about 24 satellites to provide this coverage - but the extras are there in case replacements are needed. The signals can go through clouds and glass and gasses - but not through solids... so you will not be able go get a location fix when you're underground - or under a deep tree canopy in a forest.
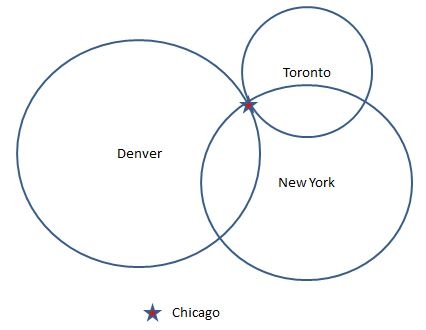
Now back on earth, these satellite signals are received with your GPS device. Essentially, your device will decode the signal, figure out how long ago it was sent and from that information it can compute it's distance from the satellite. So, how does your distance from a faraway satellite help locate you? It happens though a process called 'trilateration'. Big word, but fairly simple idea. Imagine you were situated somewhere in the middle of the USA. And you had a big map in front of you. Imagine you were given 3 figures, each a distance from a fixed location. For example, New York - 713 miles; Denver - 913 miles; and Toronto - 437 miles. With this information you could use the map scale to draw three big circles from each of the fixed locations. And the three circles would intersect in only one place - Chicago.
So that's fine for fixed locations on earth - but satellites? It turns out to be only a little more complicated in that case. Because satellites are in space, when you have the distance, you have to think about the possible locations as being on the edge of a sphere instead of the circle we drew on the map. And your location would be the intersection of the spheres from each of the 4 satellites your device was using.
The rest of the story is simply software. Your GPS device will calculate the location as a pair of co-ordinates. One is latitude (your north/south position) and the other longtitude (your east/west position). For instance, Chicago is roughly 41° 46' 0" latitide and -87° 37' 20" longtitude. Then, your device will usually overlay this coordinate on a map that it has in its memory. All that to tell you how to find the way to Aunt Sally's new house!
This year the National Geographic Society marks the 100th anniversary of their cartographic department. And Geography Awareness week seemed a good time to celebrate this milestone. The magazine's current issue features stories on some of the more interesting maps produced over the last century.
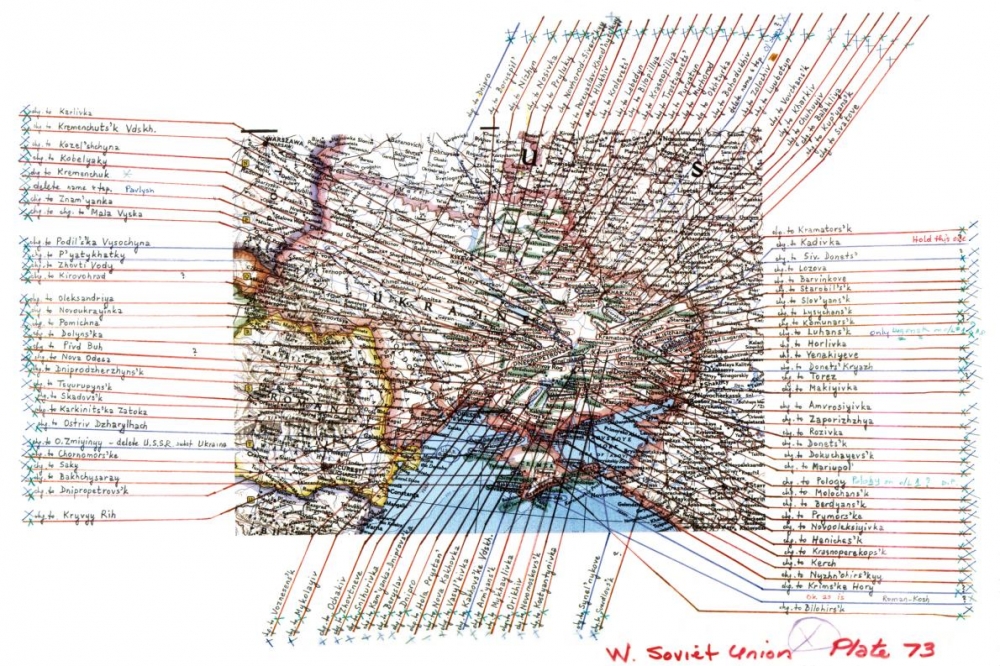
In reviewing it, you just can't help but be impressed with the breadth of maps and the unbelievable detail needed to render accurate, timely documents. One illustration shows some of the work necessary after the dissolution of the Soviet Union in 1991. This event necessitated changes to 90% of the place names in the Ukraine alone. I was certaintly struck by how manual this whole process looked. (At Lizard Point we are well aware of the detailed work involved in adjusting maps - but at least we do it all with programs and databases). In the case of the Ukraine, the illustration below shows printing and pointers overlaid on an analog map plate.
With a century of history to draw on, the National Geographic also has many rich memories. They feature the map that General Dwight D. Eisenhower carred across Germany during the Allied offensive in 1945. They also mention the story of Admiral Chester Nimitz landing lost in a rainstorm, utilizing the Society's map of the Pacific war theatre.
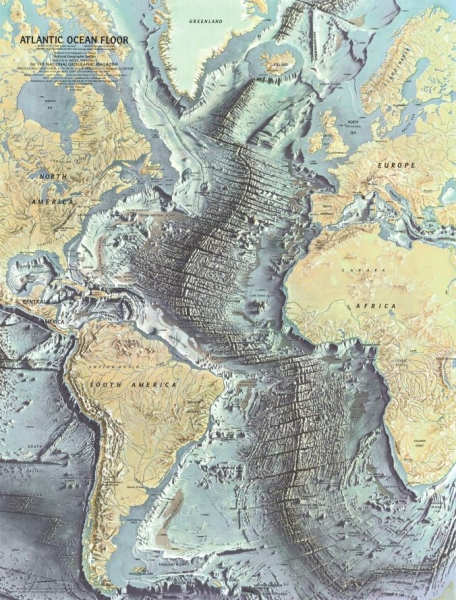
One featured map from 1968 really caught our attention. It charts the map of the floor of the Atlantic Ocean based on work of early geophysicists. Besides the beauty of the art work, what really stands out is the degree of detailed elevation in a part of the world that we are used to seeing as a uniform, flat, pale blue. This map brings home the reality of plate tectonics in a way that thousands of words could never convey.
The article closes with some words on the future of cartography with some tantalizing comments on the role of 'crowdsourced' cartography and the use of wearable technologies to increase the capture of geo-data. We can't wait.